Figure 4.
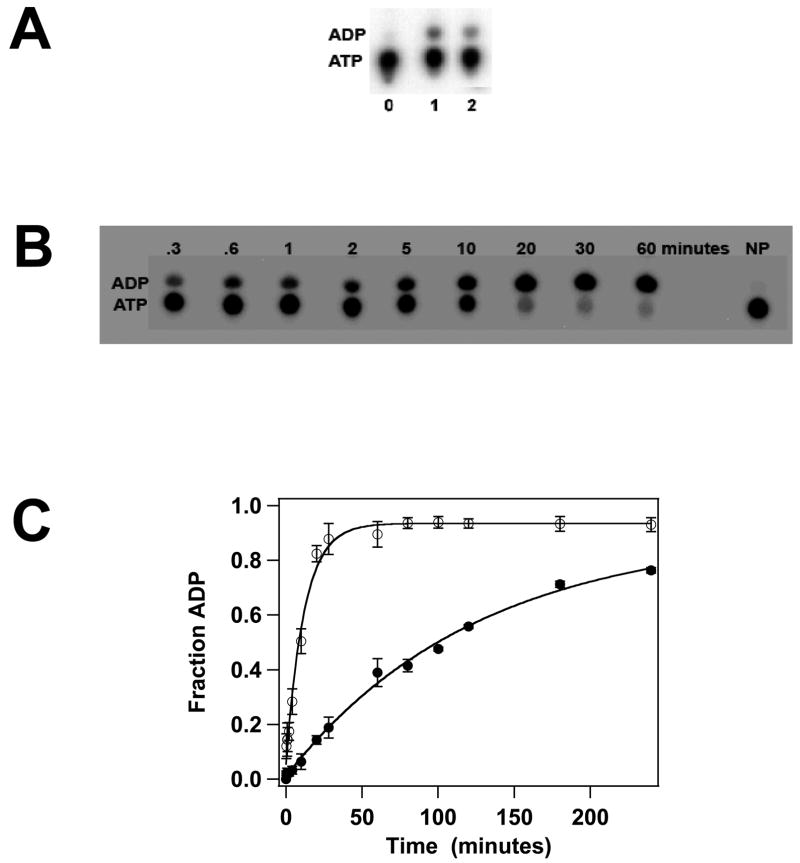
ATPase Activity of the gpA Deletion Constructs. Panel A. Steady-state ATP hydrolysis was conducted as described in Materials and Methods and a representative autoradiogram is shown. The migration positions of ATP and ADP on the TLC plate are indicated at left. Lane 0, no protein; lane 1, gpA-ΔN179; lane 2, gpA-ΔN179,K497D. Panel B. Single-turnover ATP hydrolysis was conducted as described in Materials and Methods and a representative autoradiogram for the gpA-ΔN179 deletion construct is shown. The migration positions of ATP and ADP on the TLC plate are indicated at left. NP no protein added to the reaction mixture. Panel C. Single-turnover ATPase data for gpA-ΔN179 (○) and gpA-ΔN179 (●) were quantified as described in Materials and method. Each data point represents the average of three separate experiments with the standard deviation indicated with error bars.

