Figure 5.
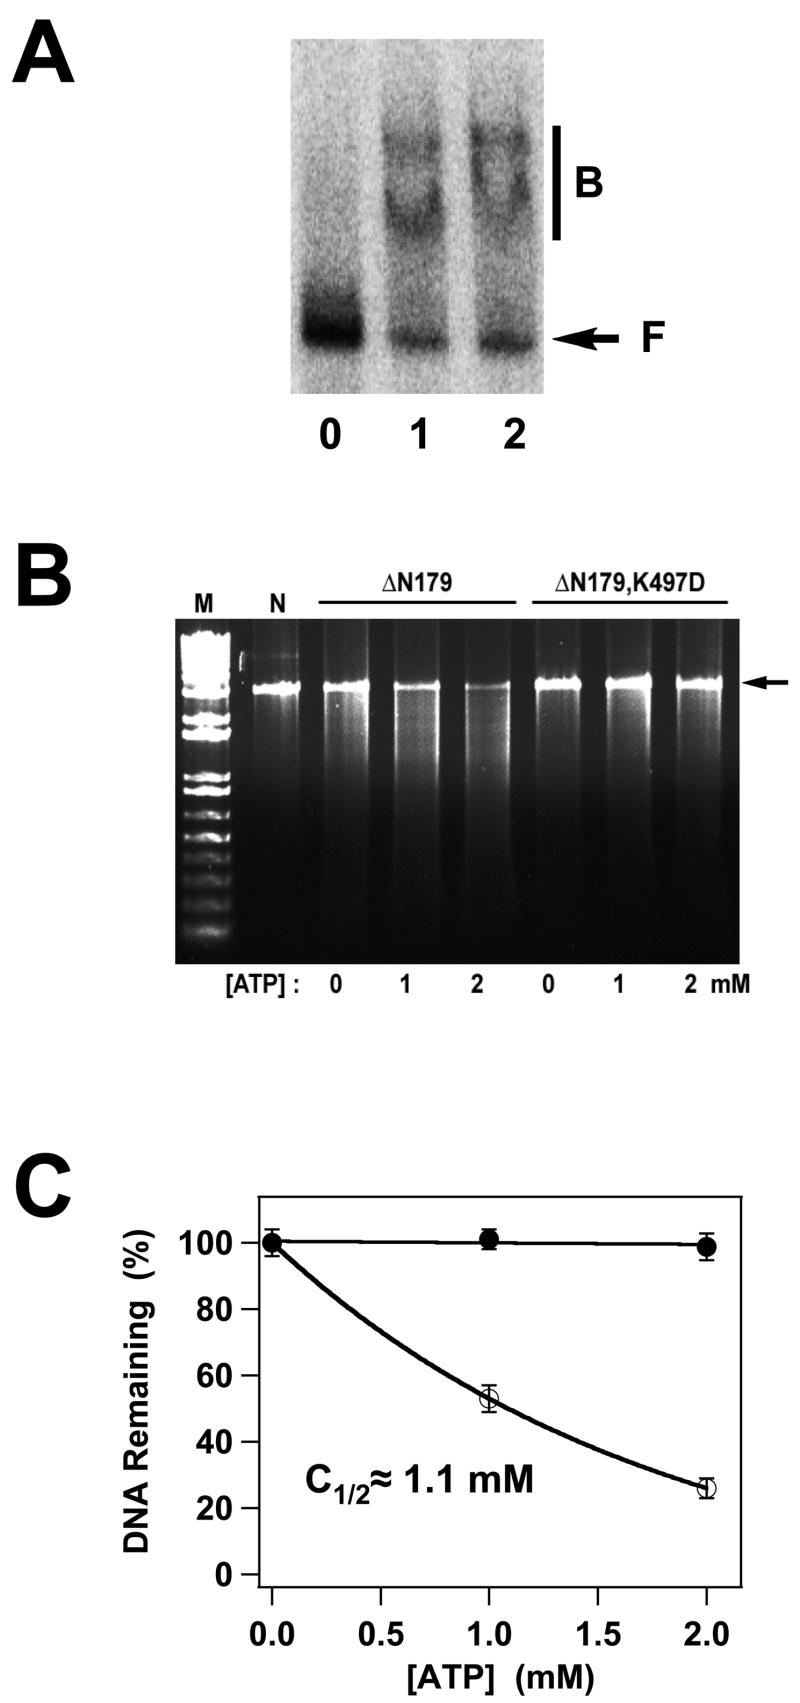
Panel A. DNA Binding by the gpA Deletion Constructs. The EMS experiment was conducted as described in Materials and Methods and a representative autoradiogram is shown. Lane 0, no protein; lane 1, gpA-ΔN179; lane 2, gpA-ΔN179,K497D. The migration of free DNA is indicated with an arrow (F), while bound DNA is indicated with a bar (B). Panel B. Nuclease Activity of the gpA Deletion Constructs. The nuclease assay was conducted as described in Materials and Methods and a representative gel is shown. Lanes M and N contain 1 kb DNA standards and the pAFP DNA substrate, respectively, in the absence of protein. The migration position of the DNA substrate is indicated with an arrow at right. GpA-ΔN179 or gpA-ΔN179,K497D proteins were included as indicated at the top of the figure and in the absence or presence of ATP as indicated at the bottom of the gel. The plasmid pAFP1 contains an intact cos site; specific cleavage at cos would afford 2 kb and 1 kb product bands, which are not visible in the gel. The nuclease activity of the protein is thus non-specific. Panel C. The data for gpA-ΔN179 (○) and gpA-ΔN179,K497D (●) presented in Panel B were quantified as described in Materials and Methods. Each data point represents the average of three separate experiments with the standard deviation indicated with error bars.

