
Fig. 5.
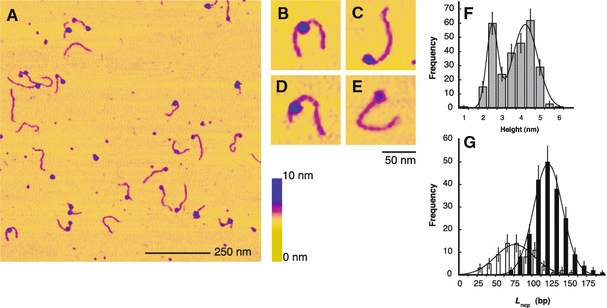
Atomic force microscopy imaging in liquid of mononucleosomes reconstituted with 172-α2 DNA. Scanning conditions were 10 mM Hepes-NaOH, pH 8.0, 10 mM NaCl. a Overview scan of a sample reconstituted at a nominal octamer to DNA weight ratio of 0.5. b–e Zooms of individual mononucleosomes. f Height distribution of nucleosomal particles. Frequencies were fitted with the sum of two Gaussian functions to derive mean height values (see text). g Distribution of wrapped nucleosomal DNA lengths Lncp, analysed separately for particles <3.0 nm height (white bars) and ≥3.0 nm height (black bars). Mean values and standard deviation of Lncp were calculated by fitting Gaussian functions to both datasets (see text). For comparison with Fig. 3, note that measured height values are larger in liquid than in air, presumably due to reduced sample–probe interactions