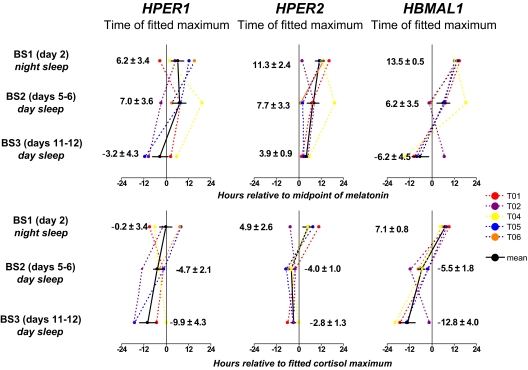
Figure S1.
The expression of central and peripheral clock markers relative to the circadian phase of (A) melatonin and (B) cortisol. For each individual, the fitted phase HPER1, HPER2 and HBMAL1 at each of three 24-hr blood sampling sessions (BS1, BS2, BS3) is shown relative to the expression of a central clock marker (melatonin in upper panels; cortisol in lower panels). Each point represents a phase angle calculated between the phase of the central (melatonin or cortisol) and peripheral clock markers. (Phase angle = [Phaseperipheral] - [Phasecentral]). Positive values indicate that the phase of the peripheral marker occurred afterthe phase of the of the central clock marker; negative values indicate that phase of the peripheral marker occurred before that of the central marker. Means for the group are shown in each panel ± SEM. The phase of central clock marker was assigned a value of zero.

