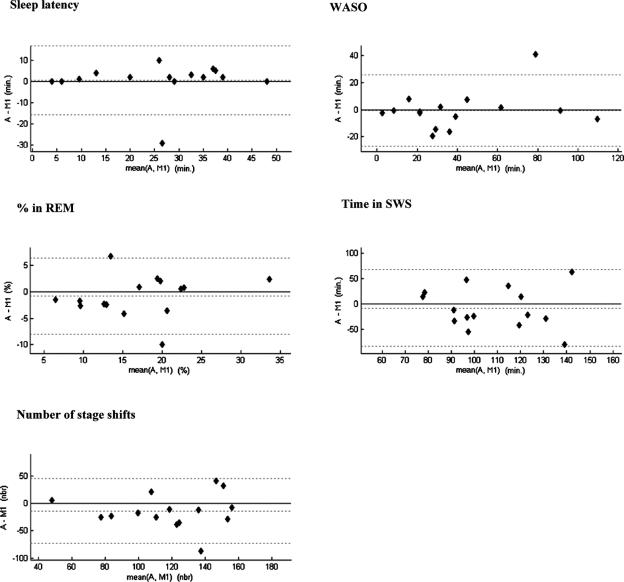
Figure 3.
Bland-Altman plots of sleep parameters showing the differences between ASEEGA scoring and manual scoring by scorer 1 versus the corresponding mean, calculated for sleep latency (min), wake after sleep onset (WASO, min), REM sleep (%), slow wave sleep (SWS, min) and number of stage shifts. The mean difference and the limits of agreement (± 1.96 SD) are represented as dotted lines. A similar figure could be drawn with the results from scorer 2.

