
Figure 4.
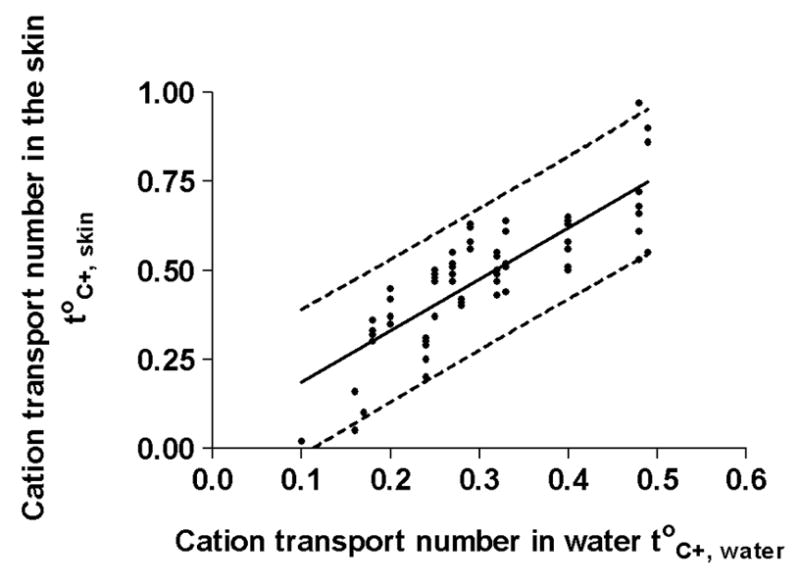
Correlation between cation transport numbers in skin with the corresponding values in water. A Pearson test shows the correlation to be strong and positive. Linear regression analysis confirms that the values in the skin are systematically higher than those in aqueous solution, a consequence of the membrane’s net negative charge and resulting cation permselectivity. The linear regression is characterized by equation 4 (see text); the dashed lines correspond to the 95% prediction interval.