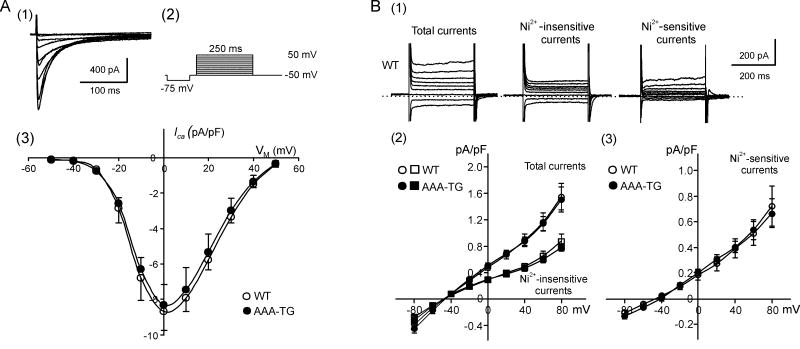
Fig. 7. ICa and INCX in WT and AAA-TG myocytes.
A. (1) Representative Ca2+ currents in WT myocytes in response to a voltage protocol shown in (2). (3) Current-voltage relationships for peak ICa in WT and AAA-TG myocytes. There is no significant difference between the two groups (n=11, n=10, respectively). B. (1) Representative background currents in WT myocytes in response to voltage steps to potentials between −80 mV and +80 mV. (2) and (3) Current-voltage relationships for total, Ni2+-insensitive and Ni2+-sensitive background currents in WT and AAA-TG myocytes measured at the end of voltage steps. There is no significant difference between any corresponding currents in the two groups (n=14, n=9, respectively). See Methods for solution composition.

