
Figure 4.
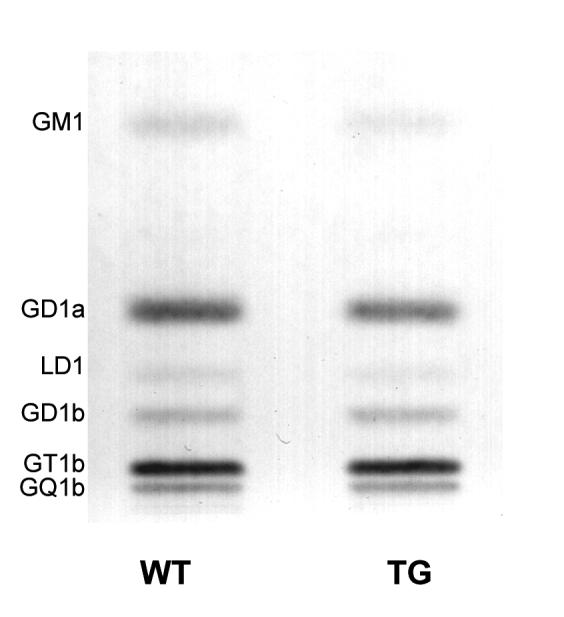
HPTLC of gangliosides in the R6/1 transgenic mice forebrain. Quantitative analysis of the individual gangliosides in transgenic and wild-type mice forebrain (cortex and striata pooled together). The amount of ganglioside sialic acid spotted per lane was equivalent to approximately 1.5 μg. The plate was developed by a single ascending run with CHCl3:CH3OH:dH2O (55:45:10 by vol) containing 0.02% CaCl2 · 2H2O. The bands were visualized with resorcinol-HCl spray.