
Figure 2.
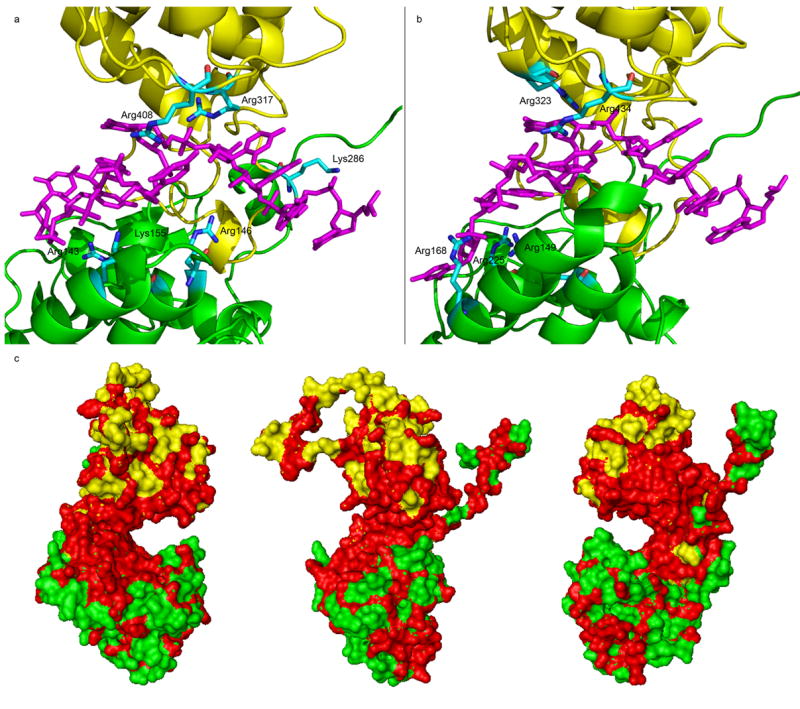
The RNA binding cavity. (a) The interactions of the positively residues with the RNA in the RNA binding cavity of the VSV N-RNA complex. The RNA is shown as a stick model (magenta) and the N-domain (green) and C-domain (yellow) of the N protein are shown as ribbons. The positively charged residues that coordinate with phosphate groups are labeled. (b) The interactions of the positively residues with the RNA in the RNA binding cavity of the RABV N-RNA complex. The scheme is the same as in (a). (c) The surface plot of identical residues (red) in the N protein of VSV Indiana and New Jersey serotypes. The panel in the center has the RNA binding cavity facing the reader. The other two views are from each side. The N-domain is colored green and the C-domain, yellow.