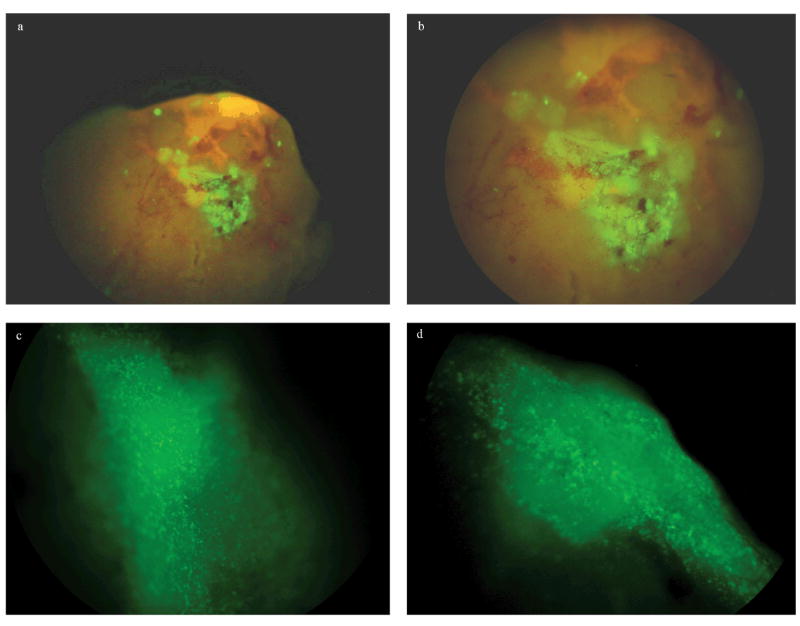
Fig 1.

Fluorescence stereomicroscopic analysis of liver samples. .Representative images of engrafted areas on freshly dissected liver samples at 10 days post injection. Fluorescence patches can be detected at low magnification (a, b); higher magnification shows that these patches are formed by clusters of GFP positive cells (c, d).
