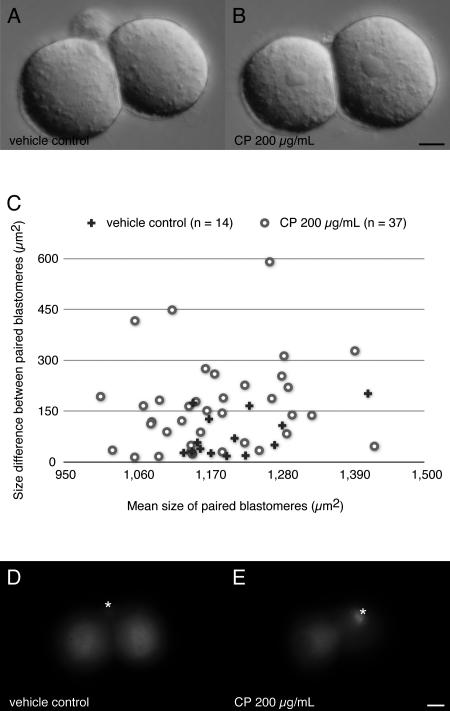
Figure 5. Effect of inhibitor for mitochondrial translation on the late pronuclei stage zygotes.
Blastomeres of the conceptuses at 2-cell stage after 24 hours in vitro culture in presence of either 1% of DMSO vehicle control (A) or 200 µg/mL of CP (B) show a size difference in these 2 treatments. Outlines of each blastomere are traced on the microphotographs then converted to the areas using ImageJ software. Pair values of the area are processed to calculate “Mean size of paired blastomeres” and “Size difference between paired blastomeres” and plotted on a scatter diagram (C). Mann-Whitney's U tests indicate there is no significant difference in “Mean size” between the 2 treatments (U = 206, level of significance 0.263), however statistical difference in “Size difference” between them (U = 150, level of significance 0.021). For the raw data set see Table S1. MitoTracker Red H2-CMXRos staining at 2-cell stage after 24 hours treatment with either 1% of DMSO vehicle control (D) or 200 µg/mL of CP (E) indicate no visual sign of retardation of the mitochondrial oxidization capability. Polar bodies (asterisks) also indicate retaining active mitochondria. Bars = 10 µm

