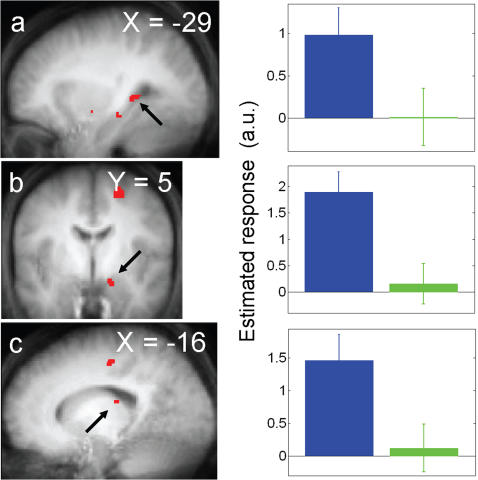
Figure 3. Significant differences between blue and green light conditions at light onset.
Left panels: statistical results overlaid to the population mean structural image (puncorrected<0.001). Right panels. Mean parameter estimates of the blue and green light conditions at light onset (arbitrary units±SEM). a. left hippocampus–b. right amygdala–c. left thalamus.

