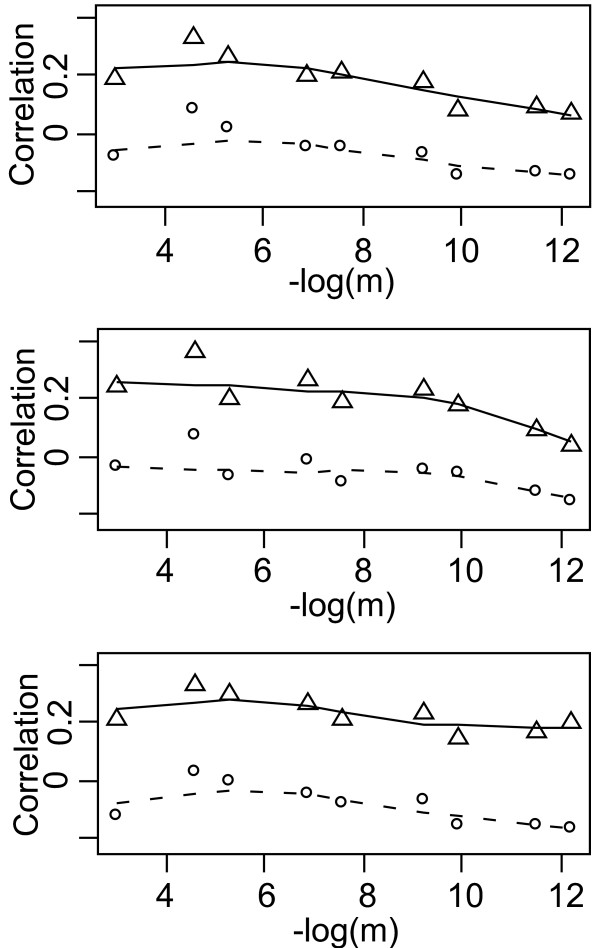
Figure 1.
Mantel and Rv correlations between atypical and other loci in the simulated data set. The parameter m is the migration rate of the simulated linear stepping stone. Each statistic is calculated and averaged between the atypical locus and the first 10 loci submitted to a stepping stone model, A) with both allele frequency and distance information, B) with allele distances without allele frequencies, C) with allele frequencies without allele distances. Plain lines with triangle-shaped symbols mark the average Rν correlation values, while the broken lines with open circles indicate the average Mantel correlation values.

