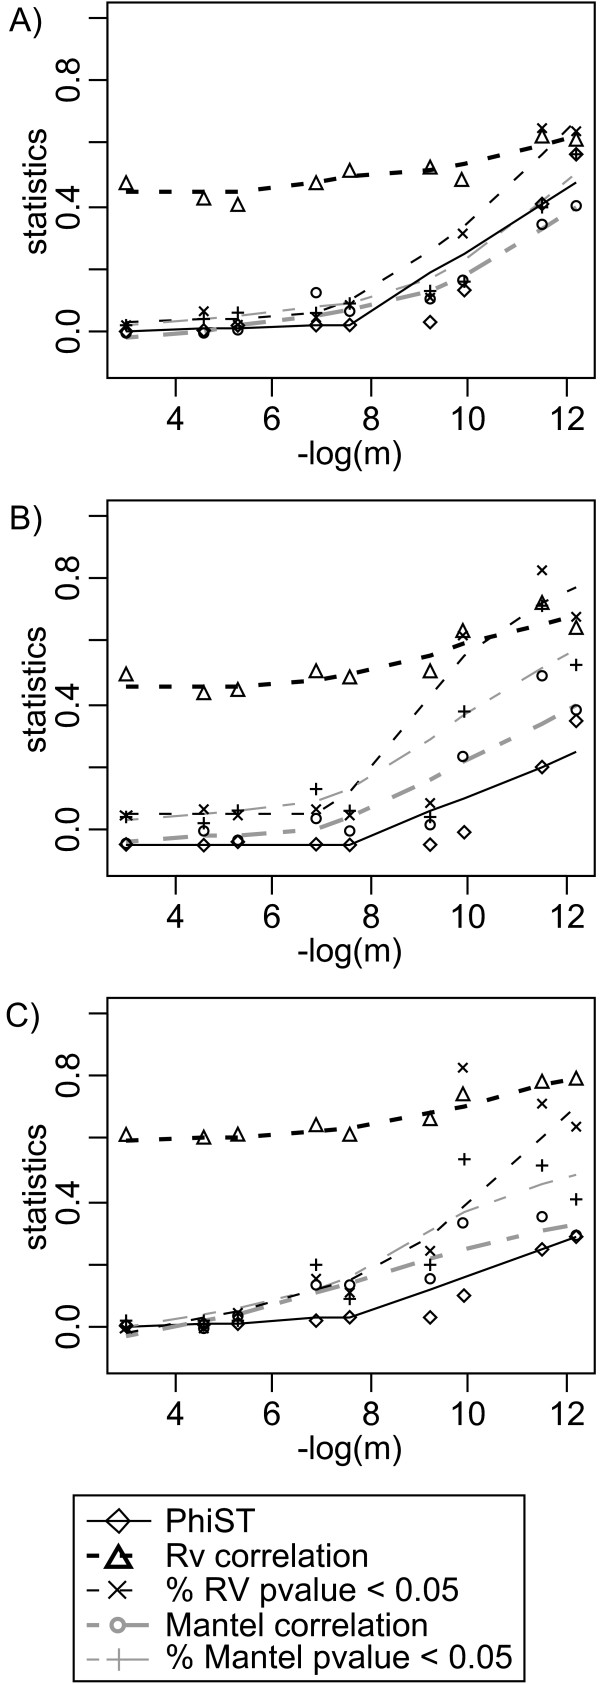
Figure 2.
Mantel and Rv correlations among the ten first loci in the simulated data set. The parameter m is the migration rate of the simulated linear stepping stone. Each statistic is calculated on 10 loci submitted to this stepping stone model, A) with allele frequency and distance information, B) with allele distances without allele frequencies, C) with allele frequencies without allele distances. Symbol legends are given at the bottom of the graphs.

