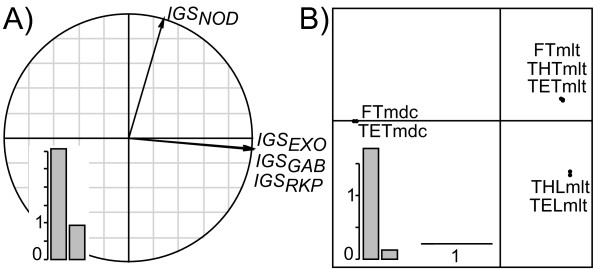
Figure 7.
Application of the DPCoA-STATIS to the real data set. A) The interstructure which displays the eigenanalysis of the Rν matrix, and B) the best compromise. Eigenvalue barplots are provided in boxes. In the interstructure (A), the smaller the angle between two loci, the more similar the inter-population patterns provided by the two loci.

