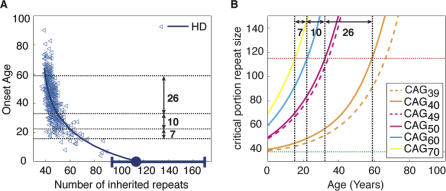
Figure 2. Exponential Onset Curve.
(A) The mechanism, with parameters fitted to the clinical data [8] of HD, predicts pathological threshold around 115 CAG repeats.
(B) The somatic expansion of repeats as a function of age of patients with HD with various inherited allele size. Onset occurs when enough cells (critical portion of 20%) cross the pathological threshold (red line). The slower expansion of shorter alleles (40–50 repeats) accounts for a larger difference in the age of onset (26 y) in contrast to longer alleles (60–70 accounts for only 7 y). A single-repeat (39–40) difference in short alleles close to the initial threshold (green line) may reduce several years from onset age compared to a single repeat difference in longer alleles (49–50).

