Figure 7.

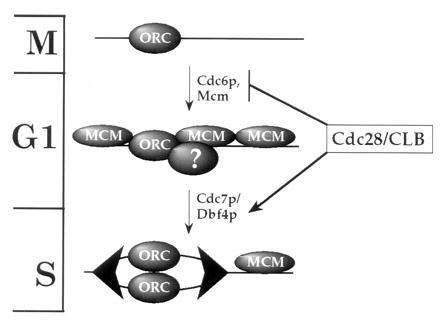
A model for the regulation of eukaryotic DNA replication. Large arrowheads represent replication complexes at forks. Cell cycle phases are indicated on the left. Details of the model are discussed in the text.

A model for the regulation of eukaryotic DNA replication. Large arrowheads represent replication complexes at forks. Cell cycle phases are indicated on the left. Details of the model are discussed in the text.