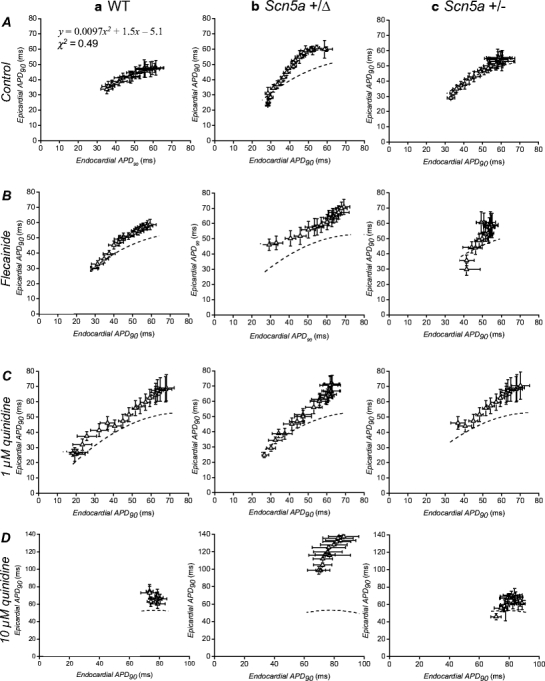
Fig. 3.

Relationships between epicardial and endocardial action potential durations (at 90% repolarization, APD90s) obtained over a range of baseline cycle lengths. WT (a), Scn5a+/Δ (b) and Scn5a+/− (c) hearts were exposed to control solution (A) and to solutions containing 1 μM flecainide (B), 1 μM quinidine (C) and 10 μM quinidine (D) and stimulated at baseline cycle lengths of between 80 ms and 175 ms. Broken lines indicate reference curves constructed by least-squares fitting of the equation y = ax2 + bx + c to data points obtained from wild-type hearts treated with control solution
