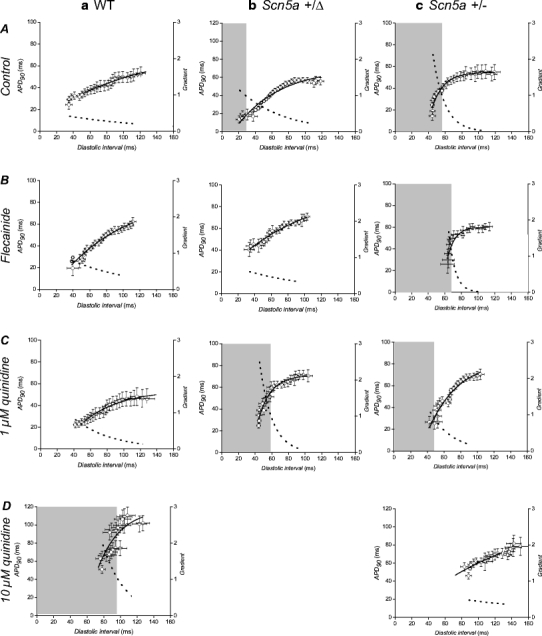
Fig. 4.

Epicardial restitution curves plotting action potential duration (at 90% repolarization, APD90) against preceding diastolic interval (DI). Data were obtained from the epicardia (circles) of WT (a), Scn5a+/Δ (b) and Scn5a+/− (c) hearts exposed to control solution (A) and to solutions containing 1 μM flecainide (B), 1 μM quinidine (C) and 10 μM quinidine (D). Curves are fitted with mono-exponential growth functions obtained by least squares fitting to the experimental values of APD90 and DI (solid lines, left ordinates). Gradients were obtained by differentiation of the fitted functions (broken lines, right axes). Shaded boxes indicate ranges of DI values at which such gradients exceed unity
