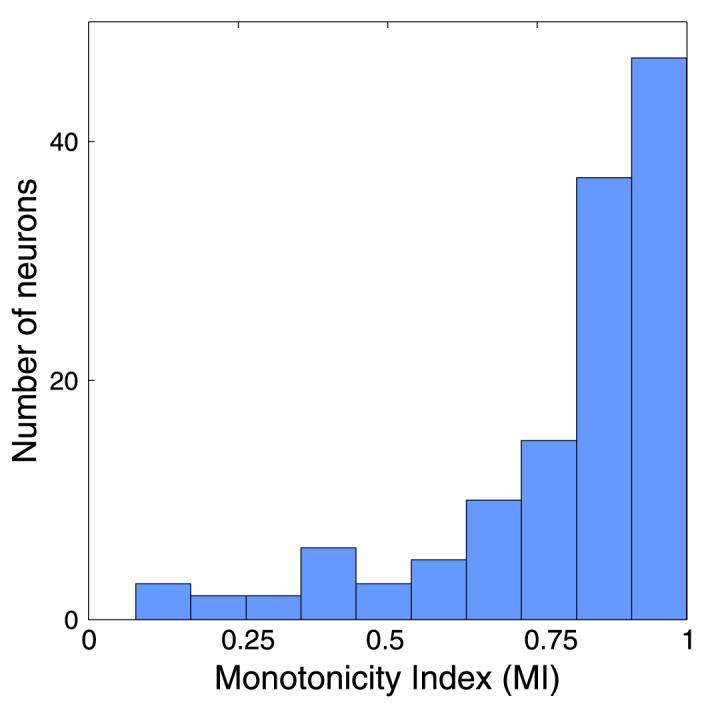
Figure 3.

Nonmonotonicity index for neurons in V1 and V2. Nonmonotonicity indices of neurons (with values that are less than 1) are shown. A value of 1 represents a monotonic neuron; a value of 0 represents a neuron whose response at maximum contrast was the same as its response at zero contrast.
