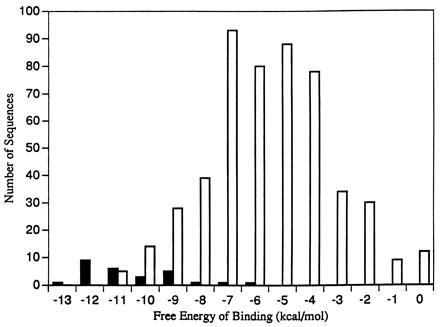
Figure 2.

The results of seven cross-validation experiments, omitting the same groups of data as in Table 3, are combined. Solid bars represent the number of times a target sequence is predicted to be bound by its specific polyamide molecule within each energetic range (i.e., the data included in Table 3). Open bars represent the number of times nonspecific binding is predicted to other sequences in the plasmids within each range. Each number on the abscissa is the upper bound of a 1 kcal/mol interval.
