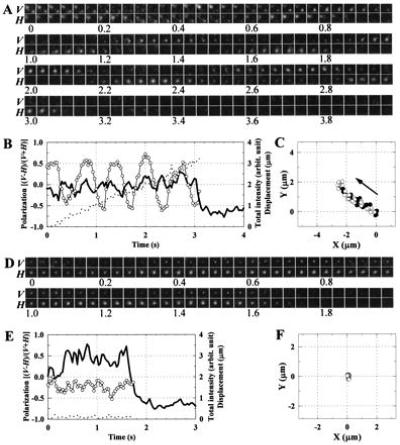
Figure 2.

Axial rotation detected in polarized fluorescence images. (A) Snapshots, at 33-ms intervals, of fluorescence from individual fluorophores on an actin filament sliding from bottom right toward top left. V, vertically polarized fluorescence; H, horizontally polarized fluorescence; numbers indicate time in seconds. Each image was spatially averaged over 3 × 3 pixels (0.66 × 0.66 μm2), and corrected for shading (due mainly to inhomogeneous excitation). (B) Time courses of the polarized spot intensities. The peak intensity of the trailing spot in A (starting at bottom right at 0 s) was measured for V and H, from which the total intensity, I = V + H (solid line), and polarization, p = (V − H)/(V + H) (○) were calculated. Because the signal-to-noise ratio was not high, the peak intensities, V and H, were not corrected for the background intensity, which varied to some extent from sample to sample and amounted to, on the average, one-third of the spot intensity; the total intensity beyond 3.1 s (also beyond 1.7 s in E) represents the background intensity. The inclusion of the background intensity resulted in smaller values of p, but our primary concern is its time dependence. Broken line indicates the displacement of the spot peak from the position at time 0. If the absorption and emission moments (assumed parallel) of the dye make an angle θ with the filament axis, and if the filament rotates at an angular velocity of ω around its axis, which lies at 45° with V and H axes, the total intensity and polarization for circularly polarized excitation are given by I = cos2θ + sin2θsin2ωt and p = sin2θsinωt/I (without correction for the large collection angle of the objective). Note that the theoretical I for a single fluorophore takes maximal values at times t when p passes either positive or negative peaks. The drop of the total intensity at ≈3.1 s resulted from photobleaching of the dye. (C) Trace of the trailing spot in A. (•), Spot positions where p > 0; (○), spot positions where p < 0. Arrow indicates the direction of sliding. The frame enclosing the trace represents the same area as each image in A. (D–F) Control experiment in the absence of ATP. The fluctuation of the spot intensity in this sample serves as a measure of the precision in A–C. The dye was photobleached at ≈1.7 s.
