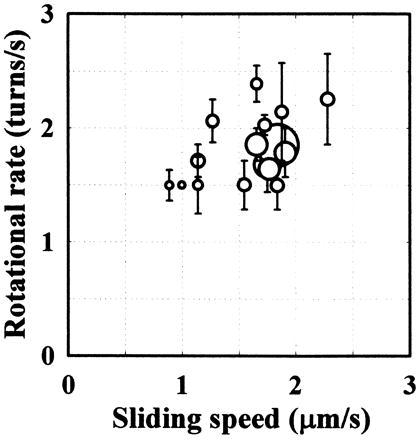
Figure 4.

The relationship between axial rotation and forward translocation. The sliding speed (abscissa) was estimated from the slope of the displacement record (broken lines in Figs. 2B and 3A). The rotational rate (ordinate) was calculated as the number of revolutions in a record divided by the total duration determined by photobleaching. The size of the symbols is proportional to the duration of the record. The average of the durations is 5.6 s, which is approximately twice the average lifetime of all single fluorophores (long-lived spots were selected for the analysis of rotation). Vertical bars indicate the uncertainty in the revolution count. In estimating the revolution count, peaks with a small amplitude or short duration (0.1 s or less) were judged as noises and ignored. In Fig. 3A, for example, the revolution count during the 14-s period was estimated to be between 27 and 29.
