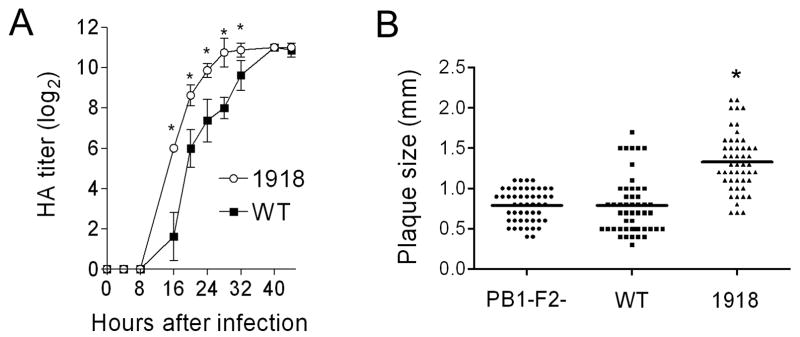
Figure 5.
Growth and plaque size of a virus expressing the 1918 PB1-F2. An otherwise isogenic virus engineered to express the PB1-F2 protein from the 1918 pandemic strain (1918) was compared to the wt PR8 strain (WT). (A) HA titer is compared for a virus expressing the 1918 PB1-F2 to wt PR8. Error bars indicate standard deviation of the measurements and an asterisk (*) indicates a significant difference at that timepoint by the paired Student’s t-test (p < 0.05). (B) Plaque size was measured for a virus expressing the 1918 PB1-F2 (1918) compared to wt PR8 (WT) and a virus that does not express the PB1-F2 protein (PB1-F2-). An asterisk (*) indicates a significant difference (P < 0.00001) compared to both other groups.

