Figure 7.

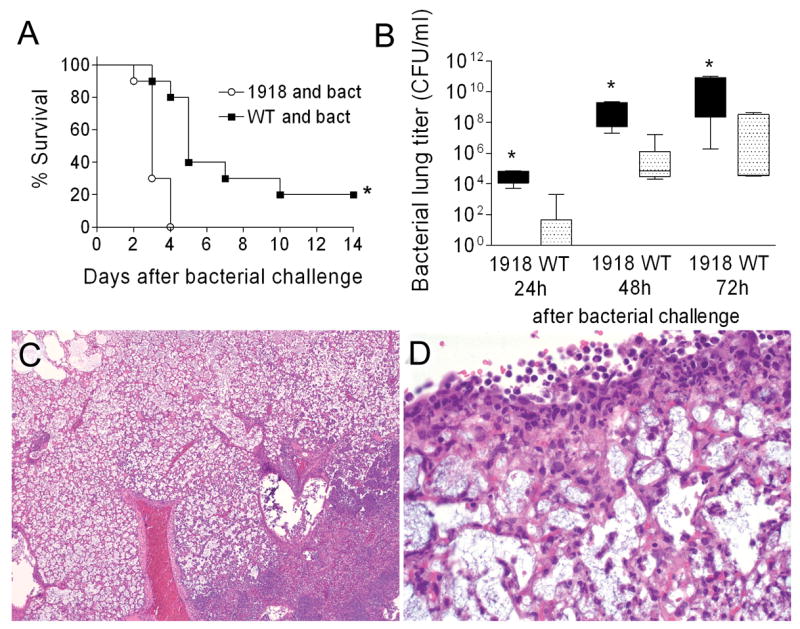
1918 PB1-F2 and secondary bacterial pneumonia. Groups of 10 mice were infected with 50 TCID50 of wt PR8 or PR8-PB1-F21918 followed 7 days later by bacterial challenge. (A) Survival following bacterial challenge is plotted, an asterisk (*) indicates a significant difference in survival by the log-rank test on the Kaplan-Meier data. (B) Bacterial lung loads from 5 mice per group and timepoint were determined 24, 48, and 72 hours after bacterial challenge. The 25th – 75th percentiles are represented by the shaded box-plots with the horizontal bar indicating the mean value. Error bars indicate the standard deviation of the measurements. An asterisk (*) indicates a significant difference (p < 0.05) by ANOVA compared to wt PR8 at that timepoint. Lungs were taken from 5 mice per group with evidence of pneumonia by bioluminescence 3 days after infection with either wt PR8 (data not shown) or PB8-PB1-F21918 (C, D). Pictured are representative sections at either 10X (C) or 40X (D) magnification. Massive, lobar, coagulative necrosis with pleuritis and leukocytic infiltration are evident.
