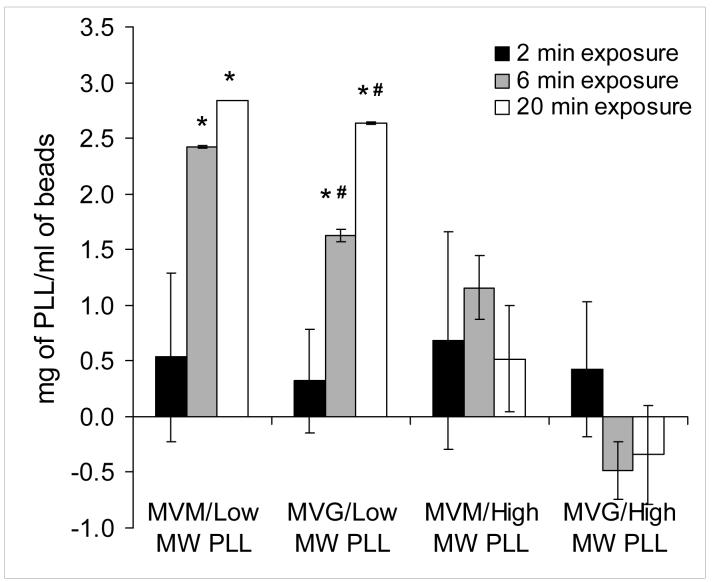
FIGURE 3.
A bar graph depicting the amount of PLL deposited per milliliter of alginate beads. Solid black, grey and white bars represent measurements based on 2, 6 and 20 minutes of exposure respectively between the various alginate and PLL combinations. Each bar is the average of duplicate measurements within the same experiment. This experiment was repeated three times with consistent results. An (*) indicates statistically significant differences (P<0.05) between the 6 or 20 minute exposures and to the corresponding alginate exposed for 2 minute to PLL. A (#) indicates statistically significant differences (P<0.05) between MVM and MVG alginates at the corresponding time exposures to PLL.

