
Fig. 3.

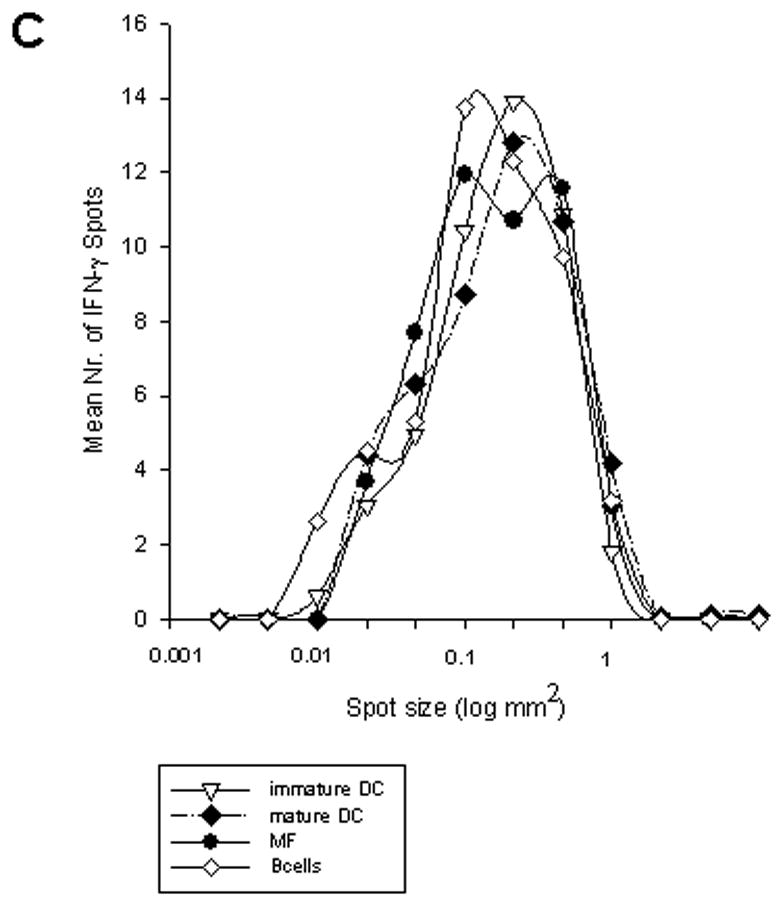
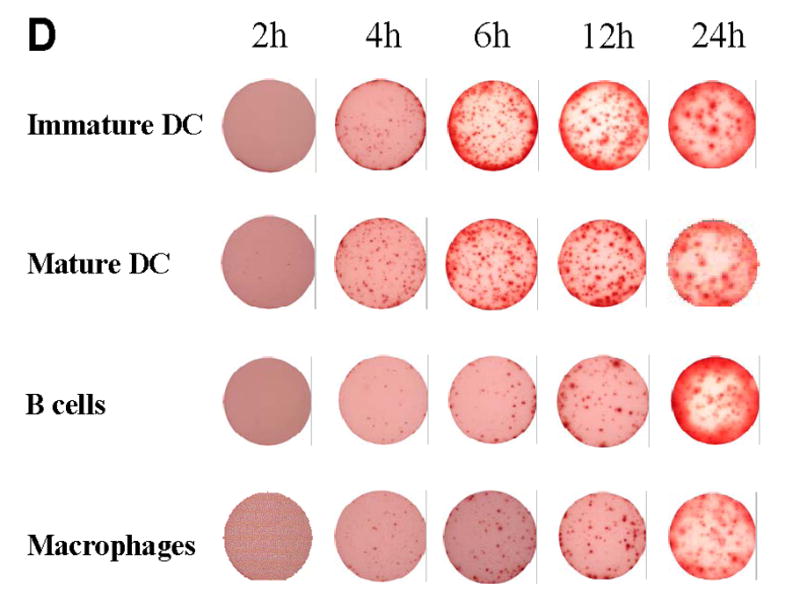
DO11.10 cells (A) and OVA peptide-specific CD4 cells (B) were stimulated with OVA peptide in the presence of immature DC, mature DC, macrophages, and B cells in IFN-γ ELISPOT assays of different durations as described in Fig. 2. Mean spot-sizes of DO11.10 and wild-type CD4 cells are shown for the individual time points. The results are representative for 3 independent experiments for both T cell groups. Each data point represents the mean of triplicate wells with SD are shown. C, spot size distribution for DO11.10 cells stimulated with maximal concentrations of OVA peptide (100μg/ml) in the presence of immature DC, mature DC, macrophages, and B cells in 24h IFN-γ ELISPOT assays. The numbers of IFN-γ spots in individual different spot size categories, corrected for the total numbers of IFN-γ spots for each APC type are shown. D, Characteristic images of ELISPOT wells at different time points of DO11.10 cell activation with OVA peptide on different APC are shown.