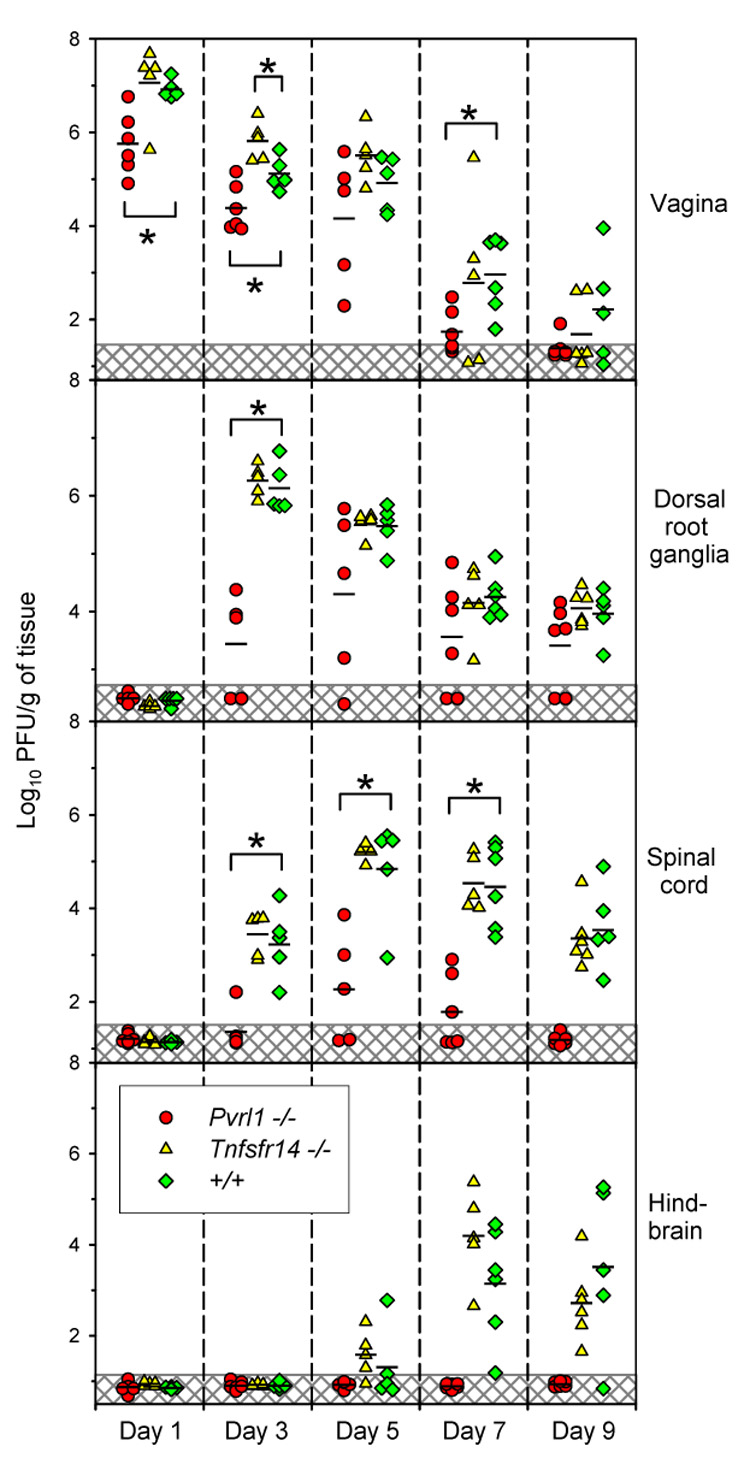
Figure 6. Viral loads in various tissues of wild-type (+/+), Tnfrsf14−/− and Pvrl−/− mice at the days indicated after inoculation with HSV-2.

The mice were treated with Depo-Provera, inoculated with HSV-2 at 6 × 10⁵ PFU per mouse, sacrificed on the day indicated after inoculation and various tissues removed for preparation of extracts and virus titrations by plaque assay. Each symbol represents PFU per g of tissue from an individual mouse. Geometric means for each experimental group are indicated by horizontal black lines (n = 5–6 for all three genotypes). Symbols in the hatched regions of each panel represent the lower limit of virus detection; values for these samples were recorded as the actual low number of PFU detected or assigned as 0.5 PFU per g of tissue when no PFU were detected. Brackets marked by an asterisk indicate that means of the viral loads detected in the +/+ mice were statistically different from those in the mutant mice (P <0.05, t test).
