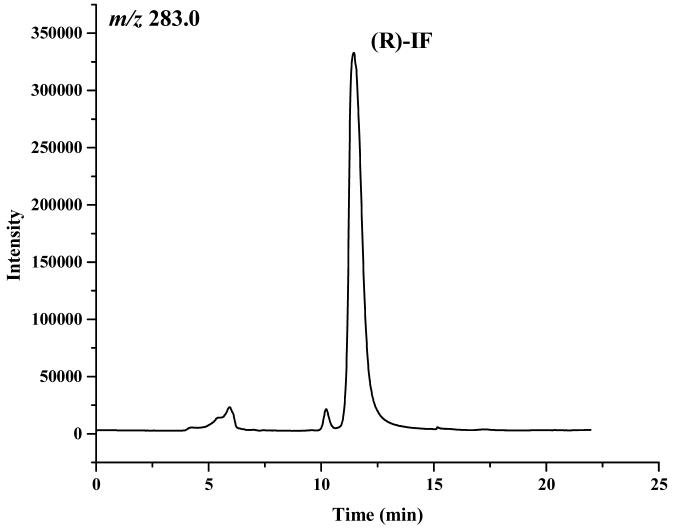
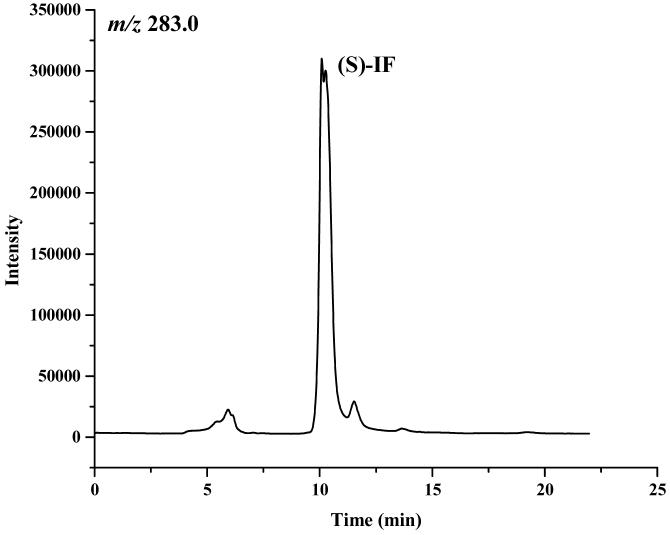
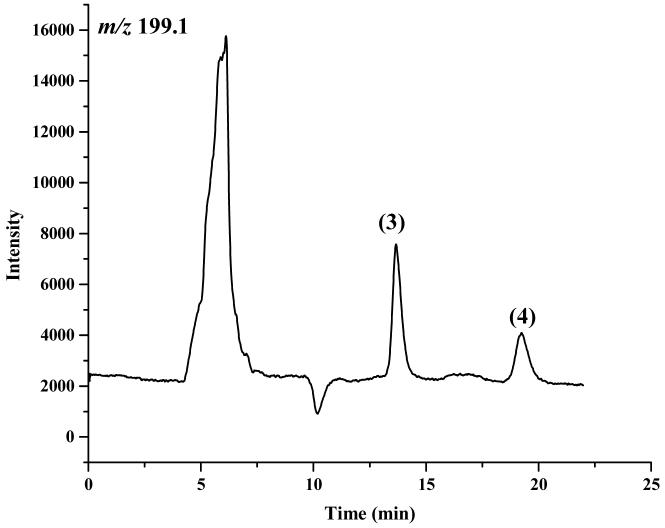
Figure 3.
The chromatograms obtained after the microsomal metabolism of: A. (R)-IF, where: 1 = (R)-2-DCl-IF, 2 = (S)-3-DCl-IF and B. (S)-IF where: 3 = (S)-2-DClIF, 4 = (R)-3-DCl-IF. The reaction mixtures were analyzed using the Chirabiotic T CSP using mobile phases 2-propanol:methanol (60:40 v/v) at a flow rate of 0.5 ml/min and mass spectrometric detection at m/z 283.0 (IF) and m/z 199.1 (2-DCl-IF, 3-DCl-IF).


