
Figure 1. A quantitative scheme for 70SIC formation, emphasizing the role of IF228.
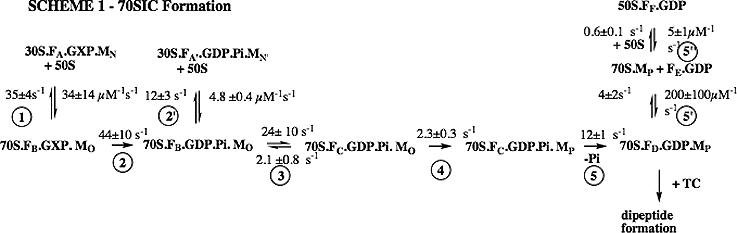
Here GXP is either GTP or GDPCP; F is IF2; M is fMet-tRNAfMet; 30S is 30S containing IF1, IF3, and mRNA; and TC is ternary complex (Phe-tRNAPhe.EF-Tu.GTP). The subscripts A-F and N-P refer to different conformations of IF2C and fMet-tRNAfMet(prf20), respectively, that have different fluorescent intensities.