
Figure 6. The effects of IF3 on 70S formation in the absence of fMet-tRNAfMet.
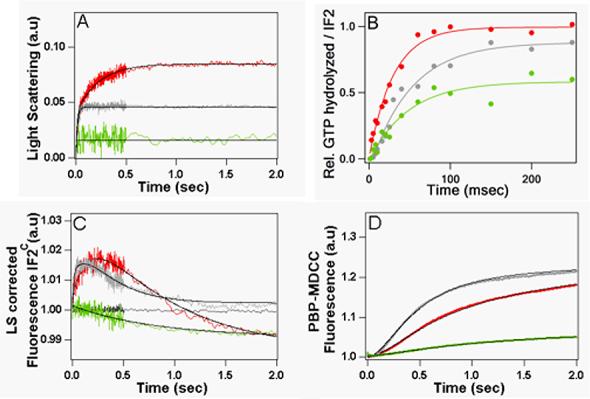
(A) GTPase. (B) Light Scattering. (C) IF2C fluorescence change and (D) Pi Release. AUG022mRNA and GTP were used in all experiments. Green traces, +IF3. Grey traces, -IF3. Red traces, reproduced from Figure 3 for comparison, are in presence of fMet-tRNAfMet and IF3.