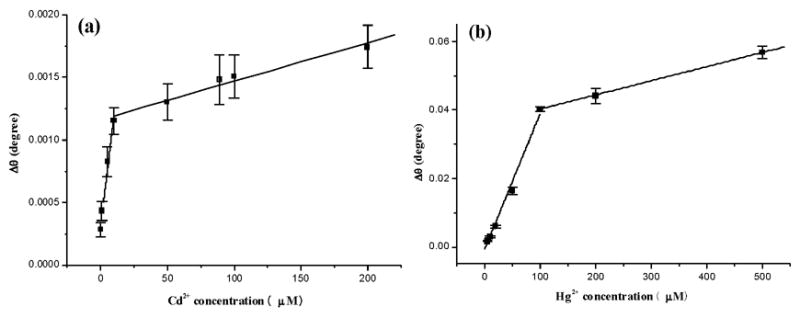
Fig. 3.

Calibration curves for the measurements of Cd2+ (panel a) and Hg2+ (panel b) using MT-covered Au sensor chips. Concentrations of metal ions injected were 0.13, 1.0, 5.0, 10, 50, 89, 100, 200 μM for Cd2+ and 5, 10, 20, 50, 100, 200, 500 μM for Hg2+. Each concentration was repeated at least three times and the standard deviations are between 9.6% and 18.6% for the Cd2+ calibration curve and range between 1.9% and 11.6% for the Hg2+ calibration curve.
