
Fig. 5.
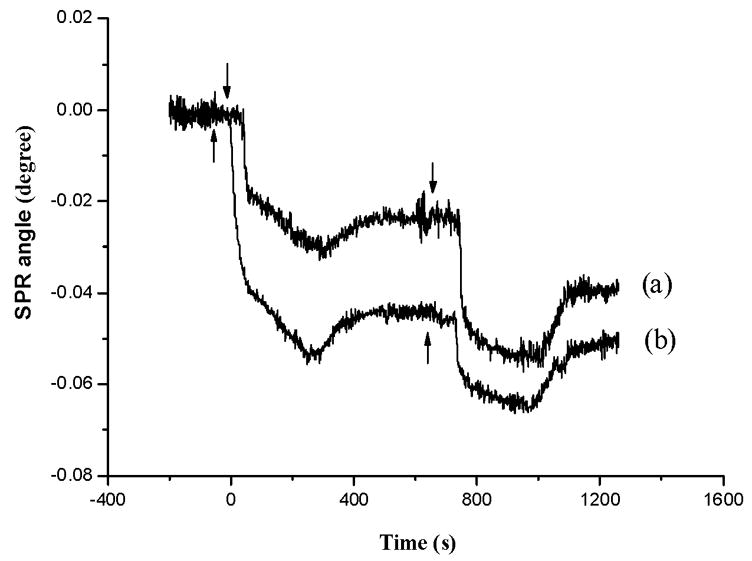
SPR sensorgrams corresponding to continuous injections of solutions containing (a) 50 μM Hg2+ and (b) 200 μM Hg2+. Arrows indicate the times when injections were made.
Official websites use .gov
A
.gov website belongs to an official
government organization in the United States.
Secure .gov websites use HTTPS
A lock (
) or https:// means you've safely
connected to the .gov website. Share sensitive
information only on official, secure websites.
SPR sensorgrams corresponding to continuous injections of solutions containing (a) 50 μM Hg2+ and (b) 200 μM Hg2+. Arrows indicate the times when injections were made.