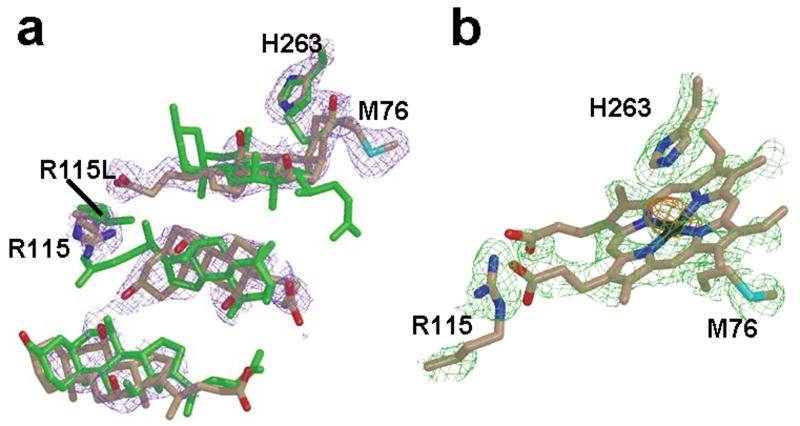
Figure 1.
Occupancy of the active site for WT1 and R115L. (a) Overlay of cholate residues and the side chains of H263, R115 and M76 of the WT1 model with the model previously reported for the R115L variant of human ferrochelatase. (b) Heme molecule modeled into the density present in the active site of monomer B of the WT1 data with side chains of M76 below and H263 above the macrocycle ring. All atoms in the WT1 model are represented as sticks with nitrogen, oxygen, carbon, sulfur, and iron atoms colored blue, red, tan, cyan, and black, respectively. All atoms in the model previously reported for R115L variant are colored green in (a). In all cases the 2Fo-Fc composite omit map was generated using the simulated annealing protocol and is contoured at 1σ (purple and green cage in panels a and b, respectively).

