Figure 6.

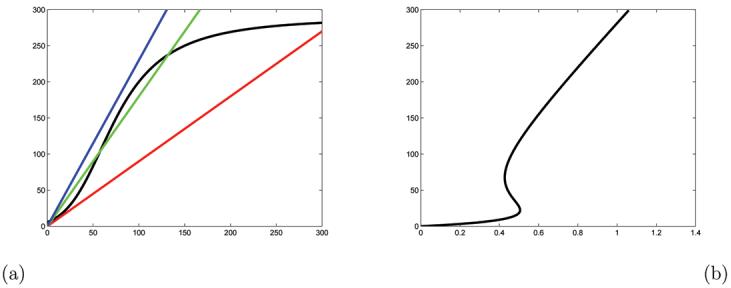
(a) The graph of the function k(u) and lines with slopes 0.9, 1.8 and 2.3; (b) The set of equilibria of the system 5 as a function of λ. These are the intersections of the graph of k(u) and the lines .

(a) The graph of the function k(u) and lines with slopes 0.9, 1.8 and 2.3; (b) The set of equilibria of the system 5 as a function of λ. These are the intersections of the graph of k(u) and the lines .