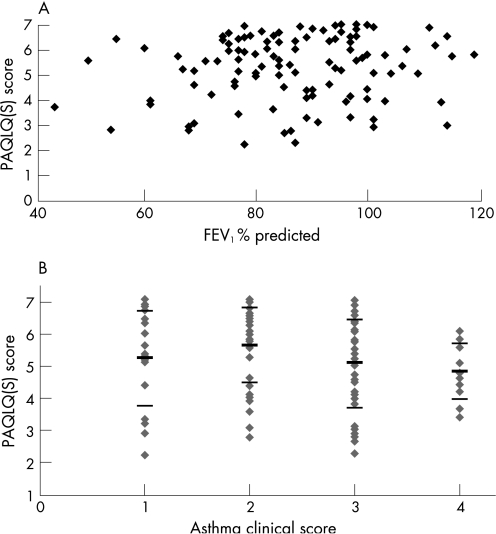
Figure 2 (A) Comparison of the PAQLQ(S) final score for the whole instrument (includes symptoms, emotional and limitations domains) and FEV1 for all 115 children with asthma. Each child is represented by a filled diamond. r = 0.117 (not significant). (B) Comparison of the PAQLQ(S) final score for the whole instrument (includes symptoms, emotional and limitation domains) for all 115 children with asthma severity score given by the physician. Each child is represented by a shaded diamond. Mean (thick black horizontal line)+standard deviation (thin black horizontal line) are shown for each clinical severity level. r = –0.17 (not significant).

An official website of the United States government
Here's how you know
Official websites use .gov
A
.gov website belongs to an official
government organization in the United States.
Secure .gov websites use HTTPS
A lock (
) or https:// means you've safely
connected to the .gov website. Share sensitive
information only on official, secure websites.
