
Figure 4.
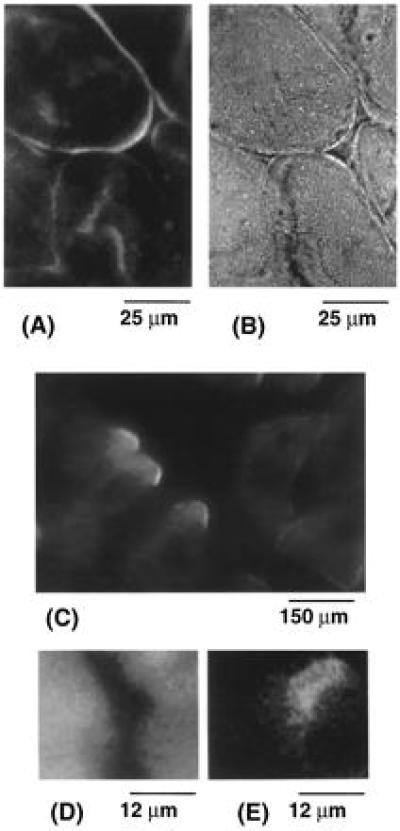
Labeling of muscle tissue sections. Frozen tissue sections (20 μm) of rat skeletal muscle on a gelatin-coated microscope slide were labeled and examined under an epifluorescence microscope. (A and B) Sections were labeled with fluorescein-conjugated anti-dystrophin monoclonal antibody and observed through a Zeiss ×63 Plan-Apo, 1.4 n.a. objective. Immunofluorescence labeling of the sarcolemma was well defined. Immunofluorescence (A) images correlated with the cell morphology observed by bright field (B) microscopy of the same field. This correlation of cell morphology with immunofluorescence is consistent with specific labeling of dystrophin on the sarcolemma by the anti-dystrophin antibody. (C) Muscle sections were labeled briefly with CY3-ATP and illuminated by a green helium-neon laser (Uniphase, Manteca, CA). Images illustrate labeling at intracellular sites and strong signals at the cell periphery which might erroneously be interpreted as colocalization with dystrophin by immunofluorescence. In contrast, Fig. 2 shows no resonance energy transfer between CY3-ATP and terbium chelate-conjugated anti-dystrophin antibody in dual-labeled sections. (D) Muscle sections were dual-labeled with chelate-conjugated anti-dystrophin monoclonal antibody and excited by a pulsed nitrogen laser and viewed through an emission filter which allows transmission from 565 to 585 nm. Cellular autofluorescence dominates the image of three adjacent cells. (E) This field is identical to that in D but obtained after applying a delay to the charge-coupled device. This delayed luminescence image illustrates resonance energy transfer at the periphery of the adjacent cells. The intensity of this delayed emission is considerably less than that in D.