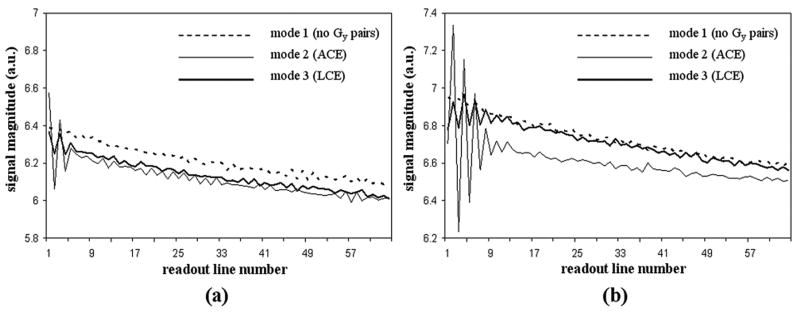
Figure 5.
Signal magnitude measured from a static oil phantom at 1.5 T (a) and 3.0 T (b). The PE gradient (Gy) pairs were selected to run in one of three modes. Signal magnitude from the 1st readout line to the 64th line decreases smoothly in mode 1 (no Gy pairs) at both field strengths. Strong signal oscillations are observed in mode 2 (paired ACE Gy gradients) especially for those readout lines close to the inserted Gy pairs. Moderate oscillation is observed in mode 3 (LCE Gy gradients). Note the fluctuations are significantly reduced from mode 2 to mode 3. The signal magnitudes of mode 3 and mode 1 are similar and they are higher than that of the mode 2 especially at 3.0 T.

