
Figure 3.
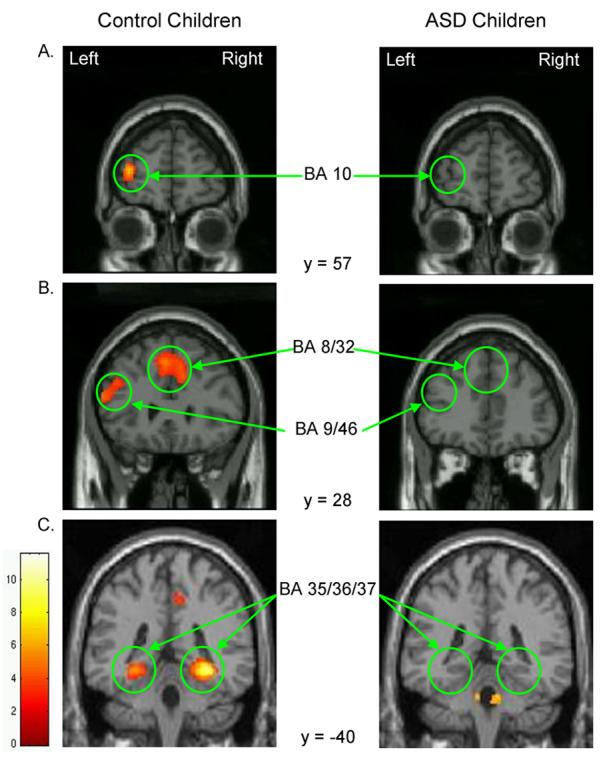
Coronal slices highlighting prefrontal (A, B) and ventral temporal (C) regions of activation that differed between ASD and control children.
Official websites use .gov
A
.gov website belongs to an official
government organization in the United States.
Secure .gov websites use HTTPS
A lock (
) or https:// means you've safely
connected to the .gov website. Share sensitive
information only on official, secure websites.
Coronal slices highlighting prefrontal (A, B) and ventral temporal (C) regions of activation that differed between ASD and control children.