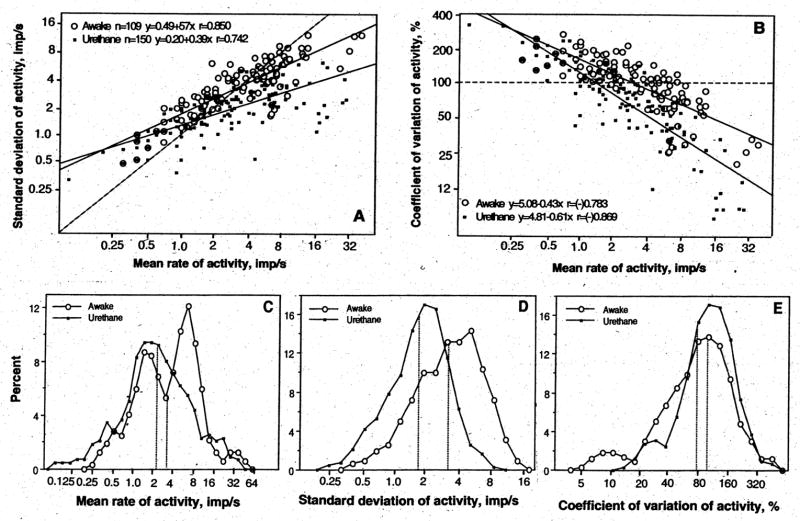
Fig. 2.
Impulse activity of striatal neurons in rats during urethane anesthesia and in awake state with DA receptor blockade. A and B show the relationships between major parameters of impulse activity. Each graph has a line of no effect (hatched), two regression lines that correspond to each condition, regression equations, and coefficients of correlations. C, D and E show distributions of major parameters of impulse activity in two conditions. Vertical hatched lines show mean values. For explanations see the text.

