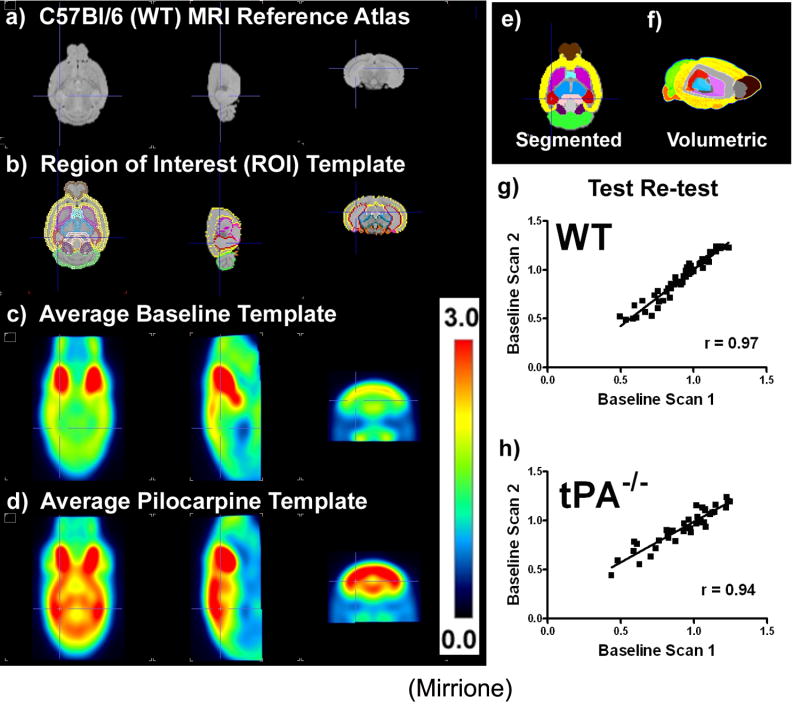
Figure 1. Templates for mouse brain data analysis and validation of longitudinal design.
a) C57Bl/6J (wt) mouse MRI reference atlas(Ma et al., 2005) (left to right views, transverse, sagital, coronal). b) Region of interest (ROI) template shown overlaid on the atlas, c) ROIs shown filled in and color coded on transverse plane, (brown = olfactory bulb, yellow = neocortex, red = hippocampus, purple = striatum, light blue = basal forebrain and septum, pink = amygdale, black = hypothalamus, light green = cerebellum, dark green = midbrain, dark purple = inferior colliculi, peach = superior colliculi, brain stem = orange). d) volumetric (3D) display of template regions with a cut out into the brain revealing the striatum in purple, thalamus in blue, and hippocampus in red, e) 18FDG baseline template and f) pilocarpine treatment template. g) Ratio to whole brain ROI statistics calculated for each individual animal’s baseline scan (scan 1) correlated with the second baseline scan (scan 2) one week later for wt (a, r2=0.9427, slope=1.154±0.04024, p<0.0001, n=4) and, h) tPA-/- (b, r2 = 0.8848, slope=0.8312 ±0.04930, p<0.0001, n=3) shown to be significant by a Pearson coefficient & regression analysis with runs test for departure from linearity.

