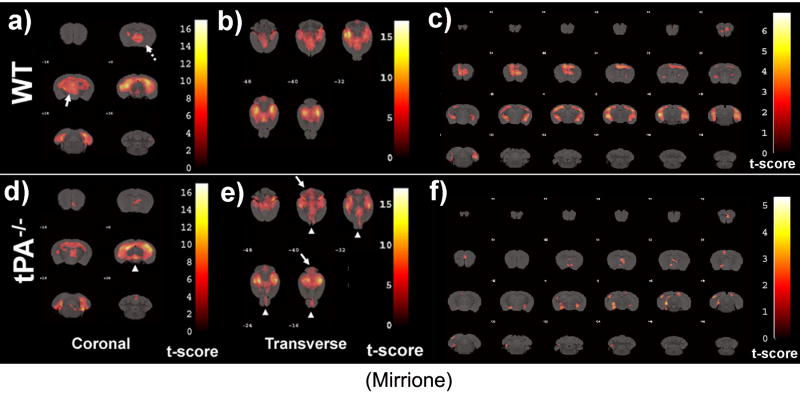
Figure 3. Voxel based analysis for neuronal activation caused by seizures.
MRI reference template was overlaid with activations caused by seizures in wild type-mice (a-c) and tPA-/- mice (d-f). For wt mice, areas of increased activation compared to tPA-/- include septum (a, dotted arrow) and thalamus (a, arrow). For tPA-/- mice, areas of unexpected increased activation compared to wt mice include the midbrain (d, arrow head), cerebellum (e, arrows) and olfactory bulb (e, arrow heads). Thresholds for displayed images were set at P < 0.001 for coronal and P < 0.01 for transverse views in order to effectively reveal differences between genotypes. SPM covariate analysis to elucidate voxels where 18FDG increased as a function of seizure severity in wt (c) and tPA-/- (f) mice. Voxels represent regions that increase in 18FDG with seizure severity. The statistical threshold (t or p value) was set at p<0.05 with an extent threshold of 100 contiguous voxels. T-scores are represented by the color scale shown.

