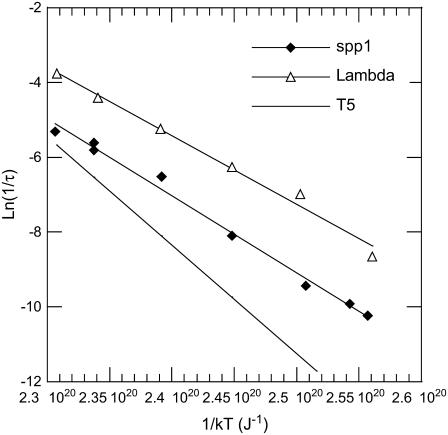
FIGURE 5.
Plot of the natural log of 1/τ against the inverse of the temperature. The observed linear relation for the two phages λ (▵) and SPP1 (♦) indicates that the decay rate constants 1/τ follow an Arrhenius law. From the slope, we extract the activation energy for each phage. By comparison, we also indicate by a solid line the activation energy previously determined in de Frutos et al. (9) for phage T5.

