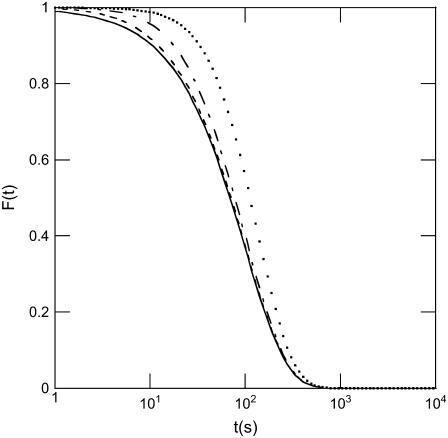
FIGURE 6.
Effect of desynchronization and of the duration of DNA movement on the expected signal for a population of phages ejecting their DNA. Modeling shows that when DNA ejection from one phage is not instantaneous and when phages are also desynchronized due to the energy barrier described in the article, the detected kinetics deviates from a simple exponential (solid line). If τej and τ0 denote the two respective characteristic times, curves expected for different ratios τej/τ0 (with τ0 = 100 s) are illustrated: τej/τ0 = 1/2 (dotted line), 1/10 (dashed-dotted line), and 1/50 (dashed line).

