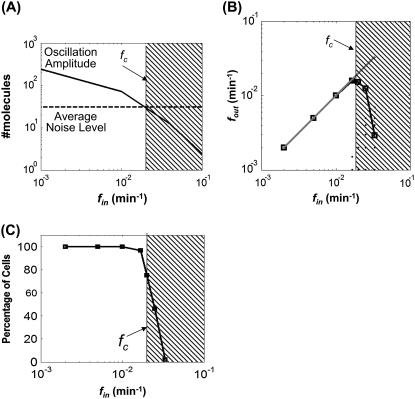
FIGURE 2.
Critical frequency for the one-stage gene circuit. (A) The amplitude of output oscillations decreased with fin. fc was calculated as the intersection between the “average noise level” curve and the “oscillation amplitude” curve. (B) Calculations of fout for varying fin using stochastic simulations. (C) Fraction of stochastic simulations that generated correct fout (i.e., where fout = fin).

