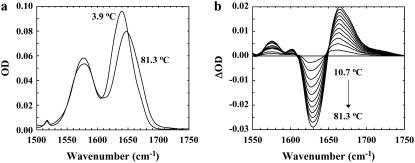
FIGURE 3.
FTIR spectra of Con-T were collected in the temperature range 3.9–81.3°C at approximately every 7°C. (a) Two representative spectra (in the amide I′ region), collected at 3.9 and 81.3°C, respectively. (b) The difference FTIR spectra generated by subtracting the spectrum collected at 3.9°C from those collected at higher temperatures.

