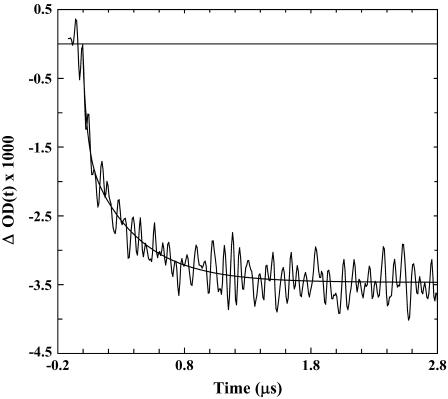
FIGURE 4.
A representative T-jump relaxation trace of Con-T measured with a probing frequency of 1630 cm−1. The corresponding T-jump is 7.4°C, from 20.4 to 27.8°C. The smooth line is a convolution of the instrument response function with ΔOD(t) = A × [1 − B × exp(−t/τ)], with A = −0.0035, B = 0.56, and τ = 0.39 μs.

