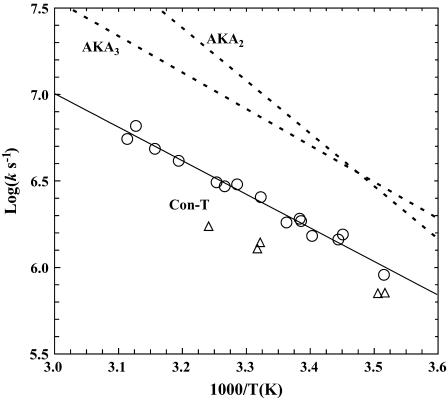
FIGURE 5.
Arrhenius plot of the T-jump-induced conformational relaxation rates of Con-T under different conditions: (open circles) 20 mM phosphate buffer (pH 7); (open triangles) 20 mM phosphate buffer (pH 7) and 2.0 M NaCl. A linear regression (solid line) to the data obtained for the low-ionic-strength solution yields an apparent activation energy of 8.9 ± 0.3 kcal/mol. Also shown for comparison are the relaxation rates of two alanine-based α-helical peptides, AKA2 and AKA3 (5).

