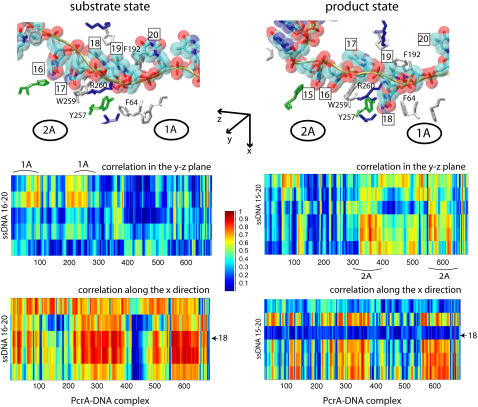
FIGURE 2.
Cross-correlation analysis of the PcrA-DNA complex based on MD simulations. The analysis was carried out for complexes in the substrate (ATP bound (left)) and product state (no ATP/ADP bound (right)). (Top) Detailed views of the bound ssDNA, as well as nearby key amino acids. The DNA is shown in both licorice and (transparent) vdW (hydrogens not shown for clarity) presentation, color-coded (red, oxygen; cyan, carbon; blue, nitrogen; tan, phosphorus; white, hydrogen), with each nucleotide labeled by a number (15 or 16–20); the amino acids are shown in licorice presentation, also color-coded (green, polar; white, nonpolar; blue, positively charged; red, negatively charged). (Bottom) MD cross-correlation maps, displaying the correlation (decomposed into two components, one in the yz plane and one along the x-direction; see text) between the ssDNA and the full complex. In the substrate state (left), movement (in the yz plane) of the right segment of the ssDNA (nucleotides 19 and 20) is strongly correlated with that of domain 1A; in the product state (right), movement (in the yz plane) of the left segment of the ssDNA (nucleotides 15–17) is strongly correlated with that of domain 2A; nucleotide 18, with its base trapped inside a pocket formed by F64 and Y257 in the product state, is relatively decoupled (along the x-direction) from the protein.

