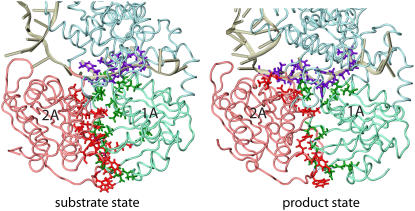
FIGURE 3.
Interfacial hydrogen bonding in the PcrA-DNA complex between domains 1A and 2A, and between protein and ssDNA. Hydrogen bonding was determined from the equilibrated (3 ns) structures for the complex in its substrate (ATP bound) and product (no ATP/ADP bound) state using the FIRST software (40), assuming an energy cutoff of −1.0 kcal/mol. The protein-DNA complexes for the two states are shown in tube format; nucleotides on the ssDNA involved in hydrogen bonding with either domain 1A or 2A are shown in purple licorice format; amino acids from domain 1A (2A) involved in hydrogen bonding with the ssDNA or domain 2A (1A) are shown as green (red) licorice. Numbers and energies of hydrogen bonds formed between domains 1A and 2A and ssDNA are provided in Table 1.

